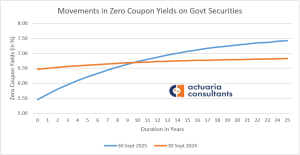
Comparison for Sept 2024 – Sept 2025:
The graph shows a significant shift in the zero-coupon yield curve over one year. The curve for September 30, 2024, is generally lower and flatter than the curve for September 30, 2025.
- The September 2024 curve starts at around 6.47% and rises gradually to about 6.82% over 25 years.
- The September 2025 curve starts at a much lower point, around 5.46%, but rises more steeply, crossing the 2024 curve at approximately the 10-year mark. It then continues to rise above the 2024 curve, ending at around 7.42% for the 25-year maturity.
Comparison for March2025 – June2025 – Sept2025:
The graph illustrates a significant downward shift in the short and medium-term segments of the yield curve from March 2025 to June 2025. This trend then continues, with a more pronounced downward shift in the short end of the curve by September 2025. Conversely, the long end of the curve shows a less volatile movement, with a slight upward trend from March to September.

- March 2025 Curve (Grey Line): This curve is relatively flat, with yields ranging from approximately 6.5% at the short end and slowly rising to just under 7.0% at the 25-year maturity. A flat curve often suggests market uncertainty and can signal a potential economic slowdown.
- June 2025 Curve (Orange Line): The entire curve has shifted downwards compared to March. Short-term yields have fallen noticeably, dropping to around 5.5% to 6.0%. This downward shift suggests that the market began to anticipate monetary policy easing, such as interest rate cuts, likely in response to moderating inflation or a slowing economy.
- September 2025 Curve (Blue Line): The downward trend for short-term bonds continues and becomes even more pronounced. The 1-year yield is now the lowest among all three curves. However, this line becomes steeper as it moves into the longer maturities, crossing over both the March and June curves at approximately the 10-year mark. After this point, yields for longer-duration bonds are higher in September than in either March or June.
Interpretation of the Trends:
The combination of falling short-term yields and rising long-term yields from June to September is known as yield curve steepening. This movement indicates a significant change in market expectations.
- Falling Short-Term Yields: The drop in yields for short-term government bonds, particularly from June to September, is a strong signal that investors are betting on imminent interest rate cuts by the central bank. This usually happens when the central bank is trying to stimulate the economy or has successfully brought inflation under control, so it no longer needs to keep rates high.
- Rising Long-Term Yields: The increase in yields for longer-term bonds from June to September suggests that while the market expects a near-term slowdown (hence the rate cuts), it also anticipates stronger long-term economic growth. This optimism about the future can be driven by a number of factors, including:
- Inflationary Pressures: The market may be concerned that the central bank’s rate cuts could lead to a rebound in inflation down the road, so they demand a higher yield to compensate for this risk.
- Increased Supply of Bonds: If the government is issuing more long-term debt, the increased supply can put upward pressure on yields.
- Global Economic Optimism: Positive developments in the global economy, such as stronger growth in key trading partners, could also contribute to the long-term outlook.